FEATURES

Read, code, explore, and test—in one research workflow.

Follow your material from import and coding to patterns, statistical results, and reports.

01

Bring your material in

Import documents, PDFs, spreadsheets, SPSS files, transcripts, captions, images, reference libraries, email, saved web pages, and supported social-media exports. Survey imports can create a case for each row, with open-ended responses as documents and other columns as case variables.

Review how columns will be used before importing. Folder imports report files they cannot read while bringing in supported material.

Good to know: PrismQDA does not transcribe recordings or download content from social-media services. Bring your own transcripts, captions, and export files. PDF coding uses extracted text rather than page regions.

02

Code text, images, and captioned recordings

Select words or whole units with the mouse or keyboard. Code image regions, or read and code a transcript while its linked recording plays. Most editing actions support Undo.

The coding workspace with one passage selected. The right-hand Segment Details pane quotes the passage, "Most days I take the bus because it's the most convenient option for me," and lists its source INT-001 Alex, lines 004 to 006, case Urban Residents, the applied code Daily Travel, an empty memo section, a note that Daily Travel is not a rated code, and the coder, Ada Lovelace, Researcher.

Select a coded passage to inspect its source, code, memo, and coder. Fictional sample data; select screenshots to view them full size.

03

Keep a codebook that develops with your analysis

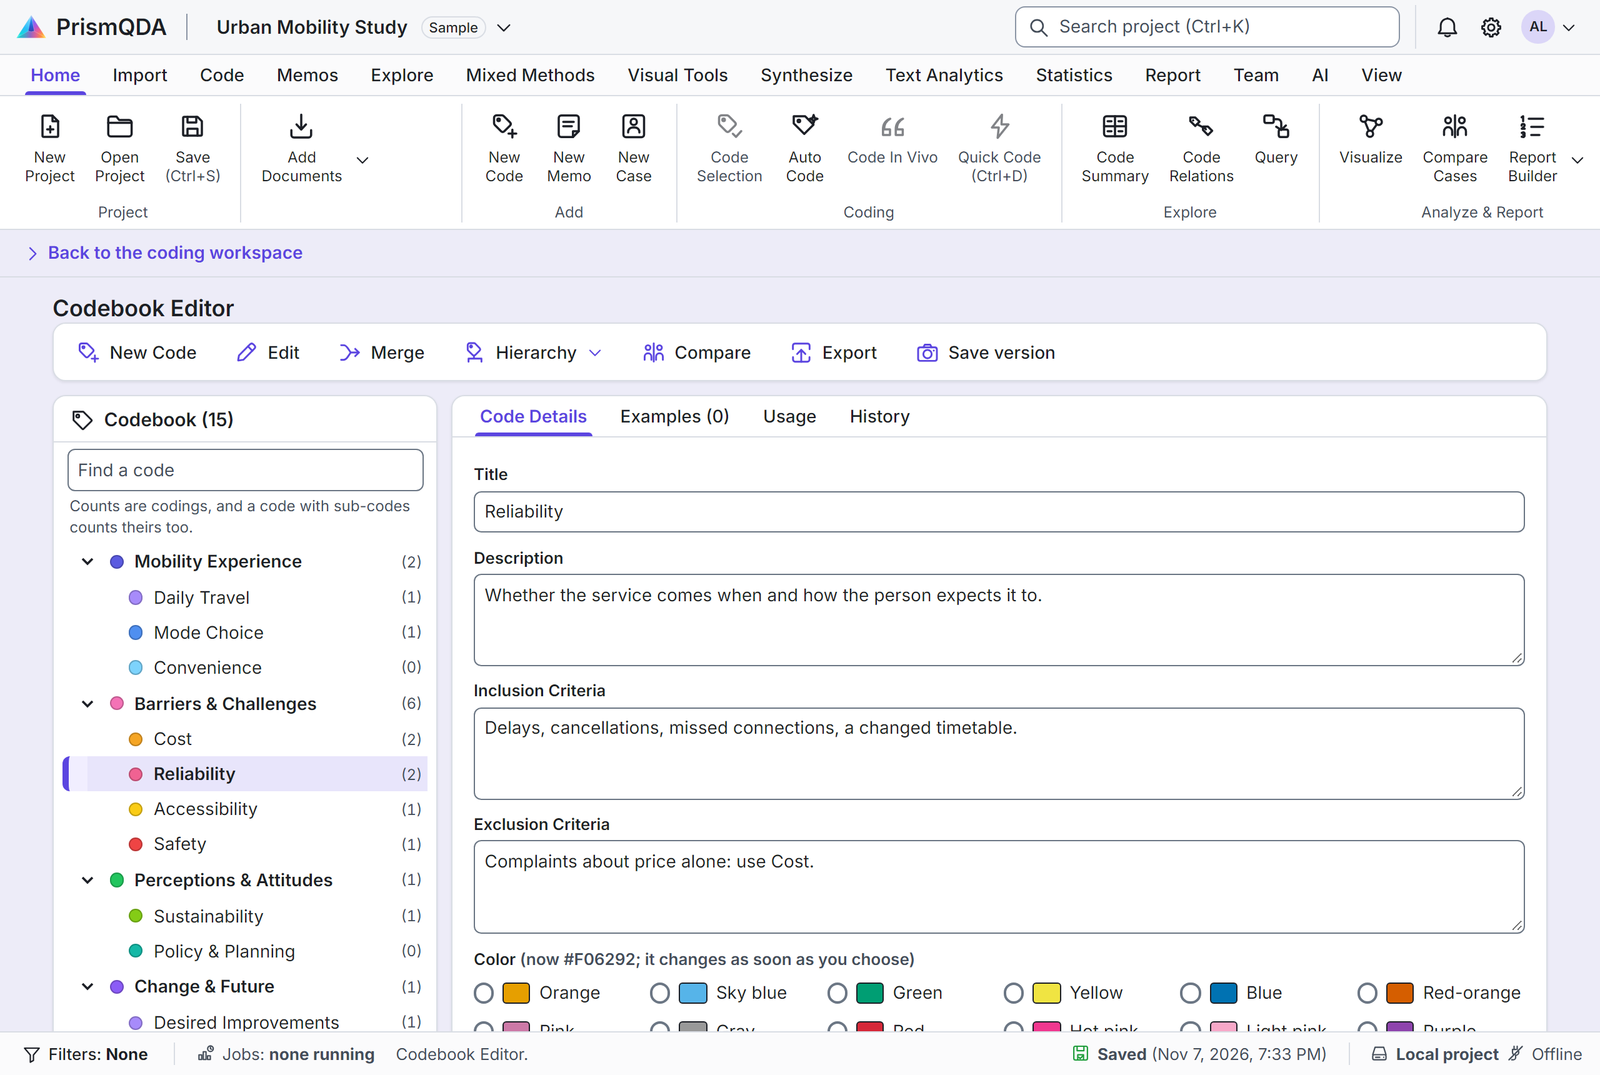
Define codes with inclusion criteria, examples, and counterexamples. Organize hierarchies, create mutually exclusive groups or rating-scale codes, and compare saved versions. Memos can be attached to coding assignments, codes, documents, or the project.

The Codebook Editor. A toolbar reads New Code, Edit, Merge, Hierarchy, Compare, Export, and Save version. On the left is a tree of fifteen codes with counts; Reliability is selected. On the right, a form for Reliability shows its title, a description, inclusion criteria, exclusion criteria, and color choices, under tabs named Code Details, Examples, Usage, and History.

Definitions, inclusion and exclusion criteria, examples, and code history.

04

Find passages and explore patterns

Search with words, phrases, wildcards, regular expressions, and Boolean or proximity operators. Retrieve coded passages, build queries, compare codes across documents or cases, and examine code relationships.

The Explore page on its Code Matrix tab. Controls choose Rows as Cases, Columns as five codes, Metric as Assignments, and Show as Numbers only. A table lists Resident 01 to Resident 08 down the side and the codes Reliability, Access, Cost, Service, and Safety across the top, with counts of 0, 1, or 2 in shaded cells and a Total column.

Compare coded themes across cases and return to the passages behind a count.

05

Review Auto Code suggestions

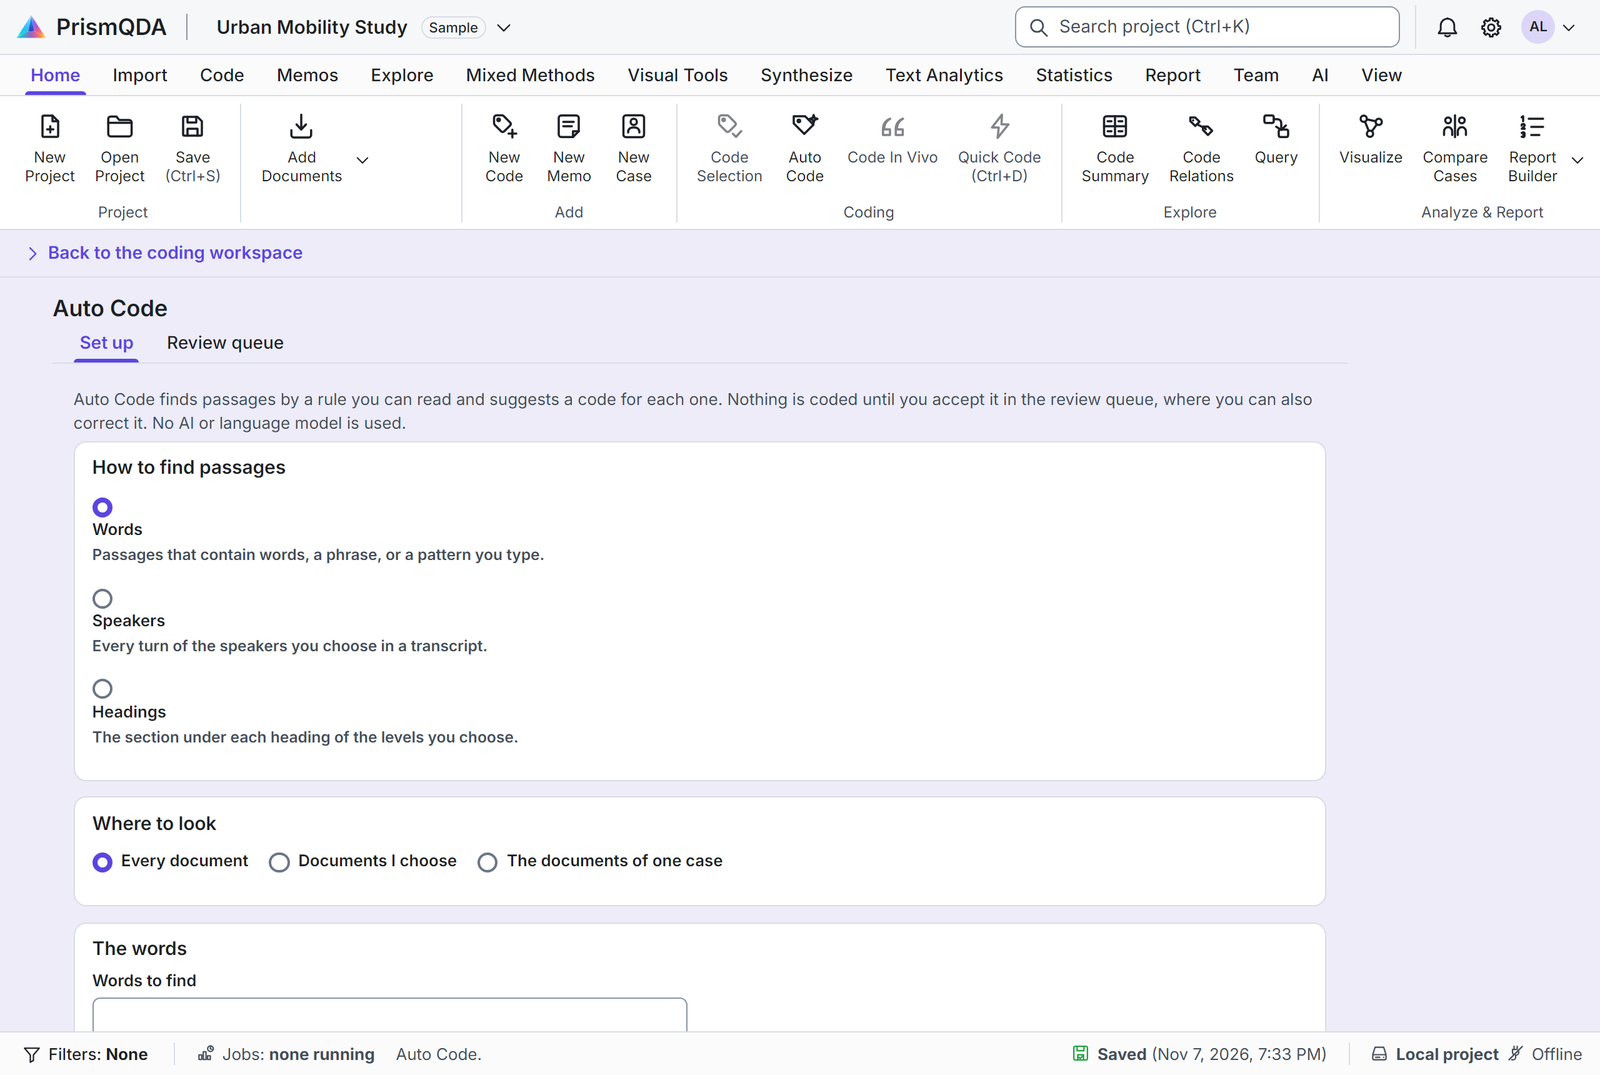
Find passages by word, speaker, or heading and review the proposed coding. Accept or reject suggestions before they become coding assignments.

The Auto Code page on its Set up tab. Text says Auto Code finds passages by a rule you can read and suggests a code for each one, that nothing is coded until you accept it, and that no AI or language model is used. Choices for how to find passages are Words, Speakers, and Headings, and for where to look, Every document, Documents I choose, and The documents of one case.

Set up rules for suggestions you review before accepting coding assignments.

06

Count words and read them in context

Explore word frequencies, with or without common words, and read keywords in context.

Good to know: Topic modeling, sentiment analysis, and word stemming are not available yet.

Preview of the word-frequency table. Select the image to view the full page.

07

Run statistical analyses

Use descriptive statistics, t tests, one-way analysis of variance, chi-square and Fisher’s exact tests, correlations, rank-based tests, multiple linear regression, and bootstrap intervals for most procedures. Results include relevant charts and notes on assumptions or data conditions.

Calculations are compared with R using synthetic datasets. The validation report documents tolerances and known differences; the FAQ lists procedures not yet available.

Good to know: The statistics notebook is not saved in the project file and cannot yet be exported to Word or Excel. Copy results you want to keep before closing the project.

The Statistics page with a one-way analysis of variance on the notebook. Page 1 shows a table of Satisfaction by group for Hillcrest, Northside, and Riverside with n, mean, and standard deviation; an analysis of variance table with F of 7.62 and p of .002; and a table of pairs of groups adjusted by Holm. On the right, the chooser lists the groups and the test options.

Tables and test options in the output notebook. Values shown come from fictional survey data.

08

Prepare case variables in the Data editor

Enter and label values, define missing values, and create variables using R-style formulas, recoding, z-scores, ranks, or ranges. Preview the result before creating a variable, with Undo available afterward.

The Data editor on its Data view. A toolbar reads Add a variable, Compute, Recode, Standardize, Rank, Cut into ranges, Undo the last change, and Go to Statistics. A grid lists Resident 01 onward with columns for Age, Site, Rides per week, Satisfaction, Age band, and Rides per year, each column headed with its level of measurement.

One case per row, with values and variables you can edit.

09

Compare coders and bring their work together

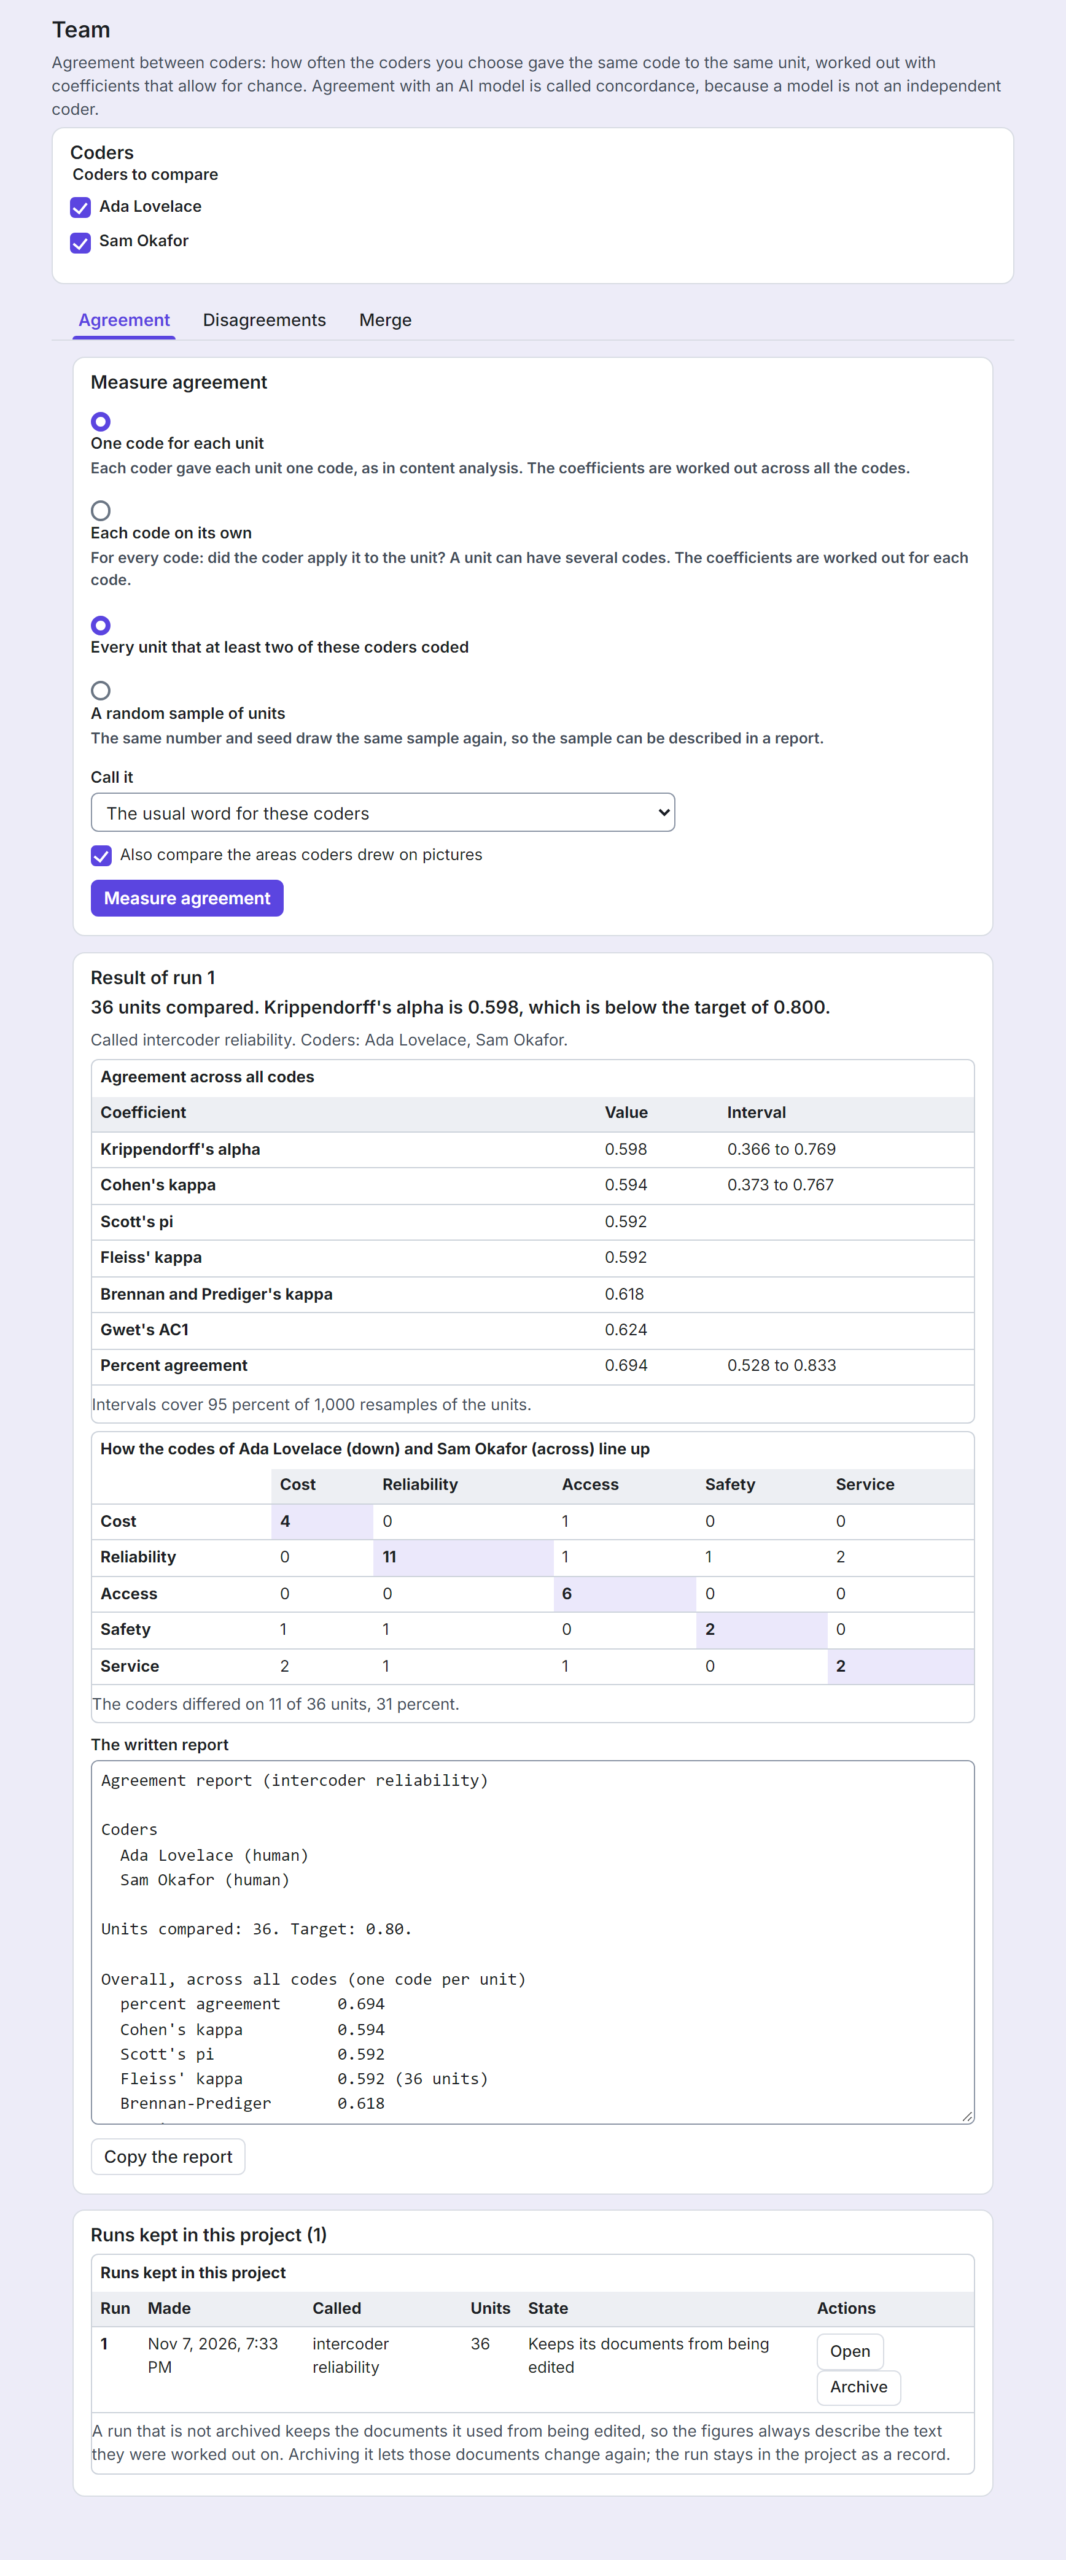
Review seven measures of agreement, per-code results, confusion tables, and disagreements. Record resolutions and merge another coder’s project copy into yours.

Good to know: Each coder works in a separate copy; simultaneous editing of the same file is not supported.

Preview of an agreement report using fictional coders and responses. Select the image to view the full report.

10

Choose whether to involve an AI service

The AI Assistant builds a plain-text prompt packet for you to inspect. PrismQDA does not call a model: you decide whether to paste a packet into a chatbot and whether to paste a response back.

Suggested passages are checked against the source text, and coding suggestions require review. Documents and codes marked do not share are excluded from packets. AI use is logged to support disclosure in your report.

Good to know: Anything you paste into a chatbot goes to that service. A matching quotation does not verify an AI interpretation.

The AI Assistant page on its Prompt packet tab. Text says PrismQDA does not connect to any AI service and that every quoted word is checked against your documents. Controls choose what to send (every document, documents I choose, or the documents of one case), the codes to ask about, whether to leave out passages already coded, how many passages (40), and a Build the packet button. A second tab is AI use log.

Prepare a prompt packet to inspect before deciding whether to use an external AI service.

11

Create reports and export your work

Build a Word report with selected project content and a draft methods appendix. Export codebooks and coded passages to Word, Excel, or CSV, or exchange a codebook using the REFI-QDA .qdc format.

Good to know: Whole-project exchange through .qdpx is not available yet. Review generated report text and add your research rationale before publication.

The Report page with three cards. The Report card offers Build a report, the Codebook card offers Export the codebook, and the Coded passages card offers Export coded passages. A line below says Statistics output arrives in a later release.

Export reports, codebooks, and coded passages. Statistics notebook export is not yet available.

GET TO KNOW PRISMQDA

Start with a sample study. Make it your own.

Download PrismQDA and choose Sample Projects to explore the fictional Urban Mobility Study before bringing in your own research.